Model Training Monitor
Tensorflow comes with a utility called Tensorboard which provides the visualization and tooling needed for machine learning experimentation:
Tracking and visualizing metrics such as loss and accuracy
Visualizing the model graph (ops and layers)
Viewing histograms of weights, biases, or other tensors as they change over time
Projecting embeddings to a lower dimensional space
Displaying images, text, and audio data
Profiling TensorFlow programs
And much more
The MLTK features the command: mltk tensorboard which internally invokes the Tensorboard utility.
Quick Reference
Command-line: mltk tensorboard –help
Tensorboard documentation: Tensorboard
Overview
The basic flow for using Tensorboard is as follows:
1) Configure the Tensorboard callback
Tensorboard must first be enabled so that the necessary logs are generated during model training. This is done by configuring the my_model.tensorboard property in your model specification.
e.g.: Add the following to your model’s Python script:
# https://www.tensorflow.org/api_docs/python/tf/keras/callbacks/TensorBoard
my_model.tensorboard = dict(
    histogram_freq=0,       # frequency (in epochs) at which to compute activation and weight histograms
                            # for the layers of the model. If set to 0, histograms won't be computed.
                            # Validation data (or split) must be specified for histogram visualizations.
    write_graph=False,       # whether to visualize the graph in TensorBoard. The log file can become quite large when write_graph is set to True.
    write_images=False,     # whether to write model weights to visualize as image in TensorBoard.
    update_freq="batch",    # 'batch' or 'epoch' or integer. When using 'batch', writes the losses and metrics
                            # to TensorBoard after each batch. The same applies for 'epoch'.
                            # If using an integer, let's say 1000, the callback will write the metrics and losses
                            # to TensorBoard every 1000 batches. Note that writing too frequently to
                            # TensorBoard can slow down your training.
    profile_batch=(51,51),        # Profile the batch(es) to sample compute characteristics.
                            # profile_batch must be a non-negative integer or a tuple of integers.
                            # A pair of positive integers signify a range of batches to profile.
                            # By default, it will profile the second batch. Set profile_batch=0 to disable profiling.
)
and configure the individual fields as necessary. See the Tensorboard Callback documentation for more details.
2) Train the model
Next, train your model. Once training starts, the Tensorboard logs will be generated at: <mltk log dir>/models/<model name>/train/tensorboard.
HINT: Add the --clean option to clear any previous Tensorboard logs, e.g.:
mltk train image_tf_dataset --clean
3) Start Tensorboard
With Tensorboard enabled, and model training started, launch the Tensorboard GUI with the command:
mltk tensorboard <model name>
Where <model name> is the filename of your model’s Python script.
e.g.:
mltk tensorboard image_tf_dataset
This will open a tab in your web-browser and display the various training stats.
NOTE: The model does not need to be actively training to use this command. You may invoke this command as long as the tensorboard logs are available in <mltk log dir>/models/<model name>/train/tensorboard.
Model Training Profiler
Tensorboard allows for profiling during model training to get a better idea of where the bottlenecks are in the data and training pipelines. This is done using the Tensorboard Profiler Extension.
When invoking the mltk tensorboard <model name> command, the MLTK automatically installs this extension.
To use this extension, ensure the profile_batch argument is specified in our model’s Python script, e.g.:
my_model.tensorboard = dict(
    ...
    profile_batch=(51,51),        # Profile the batch(es) to sample compute characteristics.
                            # profile_batch must be a non-negative integer or a tuple of integers.
                            # A pair of positive integers signify a range of batches to profile.
                            # By default, it will profile the second batch. Set profile_batch=0 to disable profiling.
)
Then, when launching the Tensorboard weboage, a Profile tab should appear:
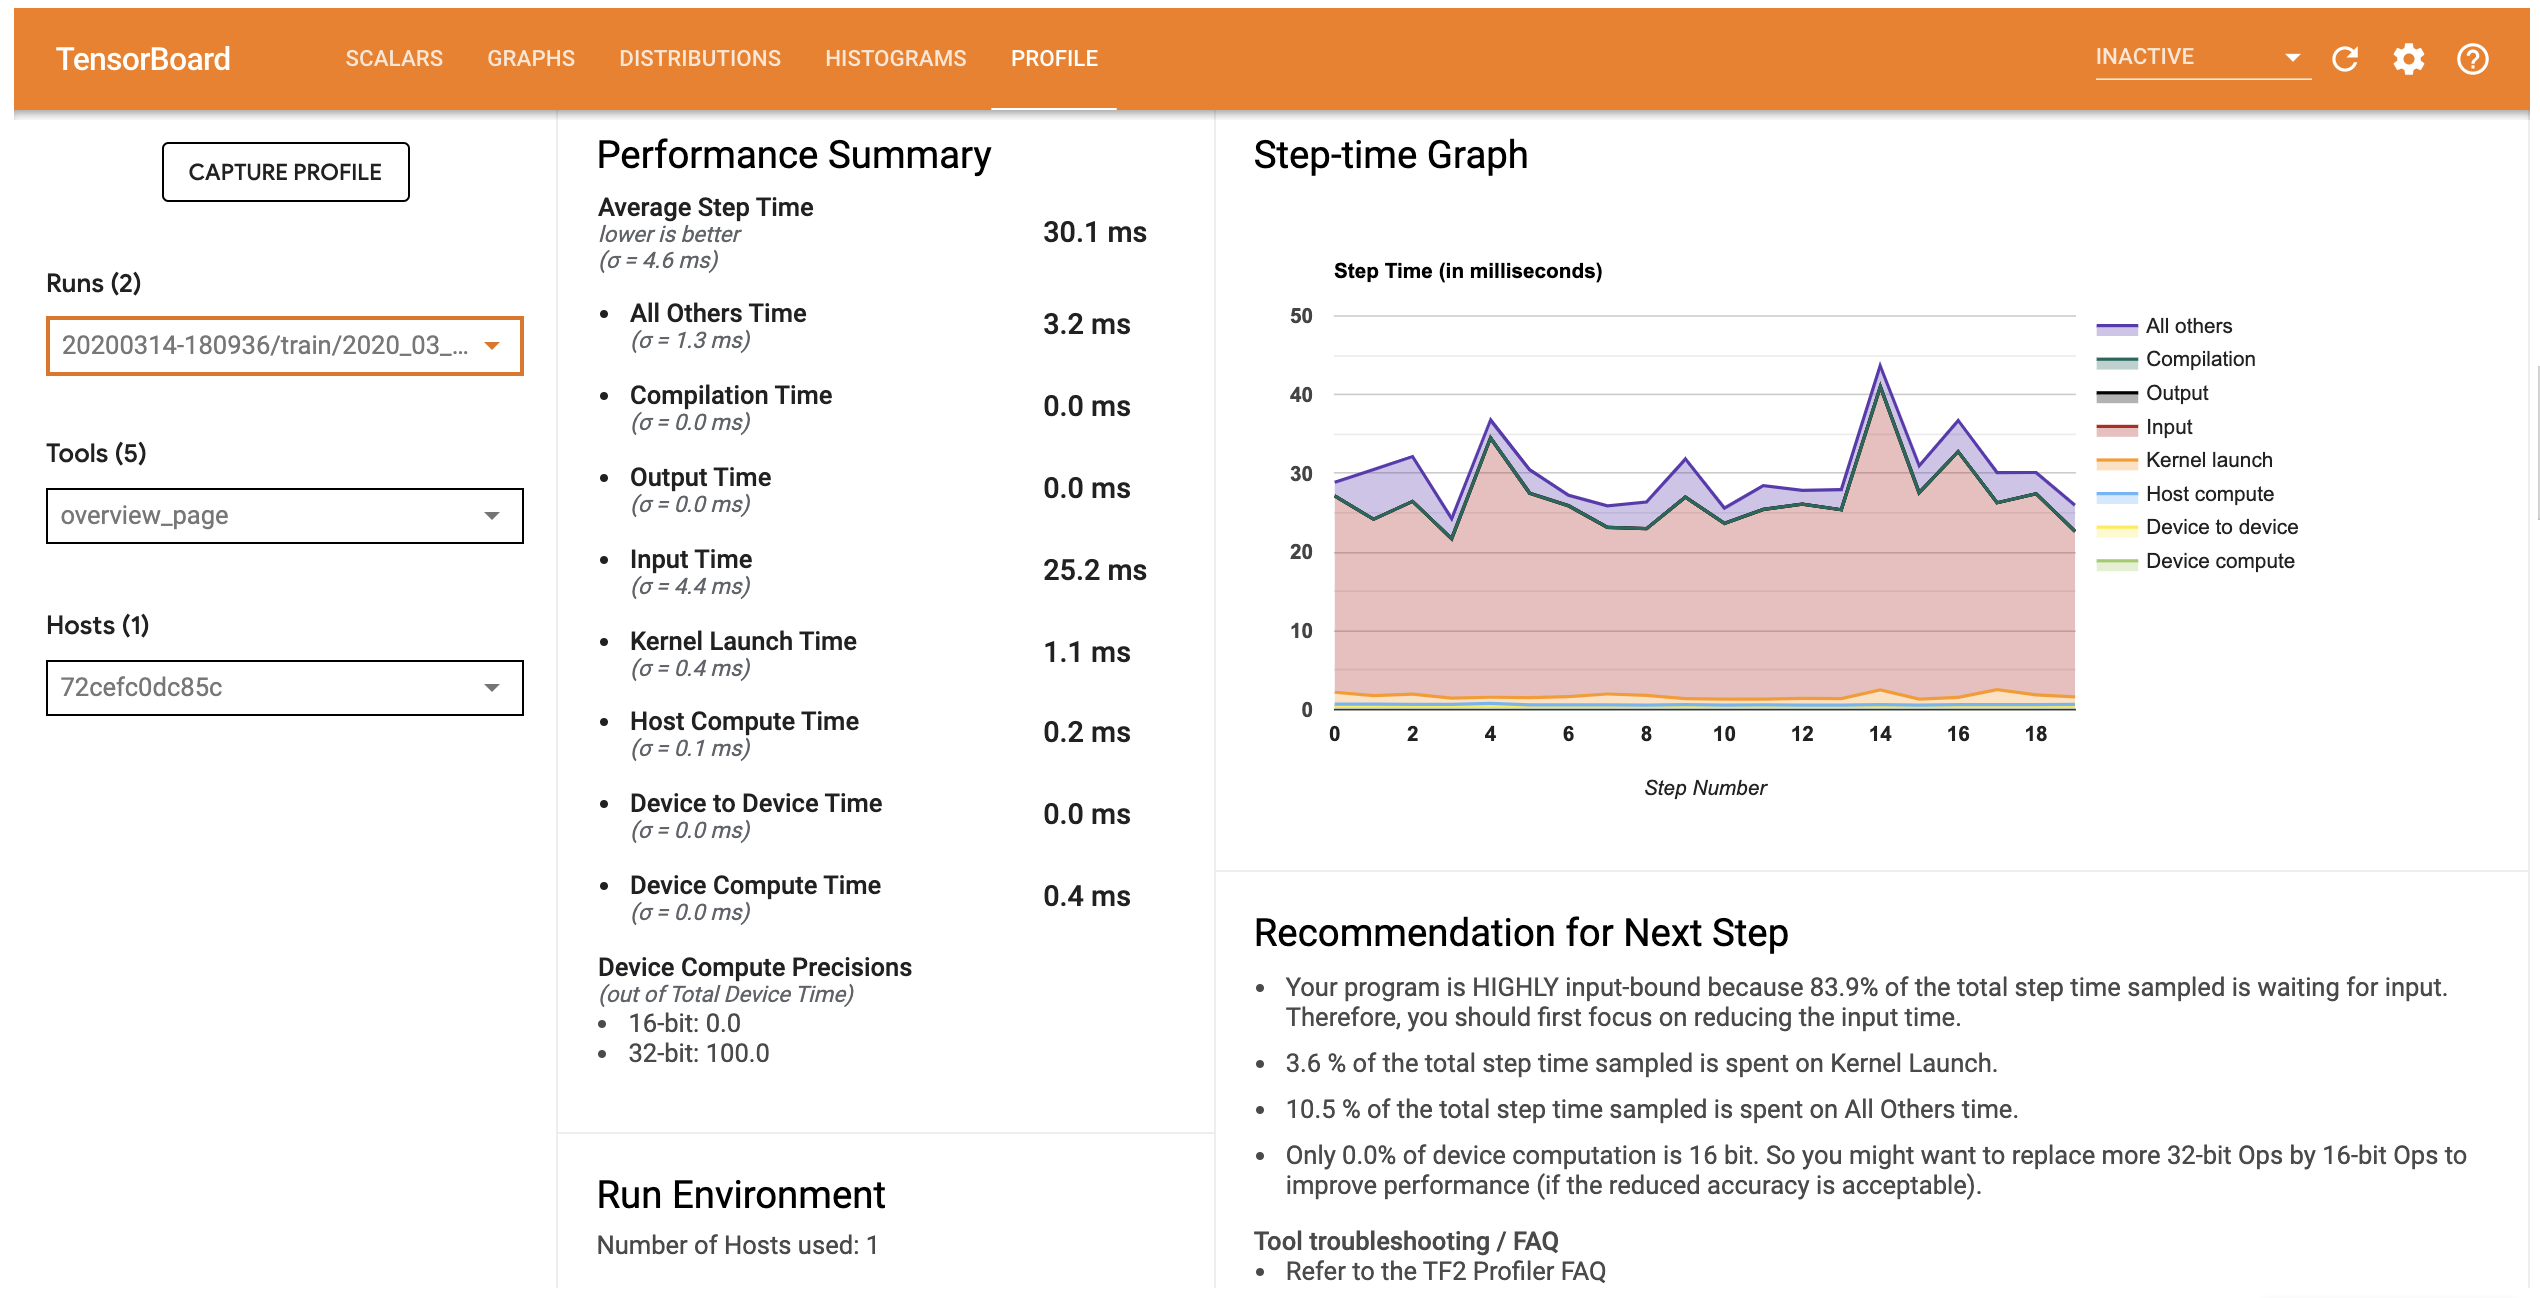
Refer to the Tensorboard Profiler documentation for more details about the information that is provided by this tool.
Troubleshoot: Profile tab does not appear
If the “profile” tab does not appear on the webpage, try:
Cleaning the training log directory, e.g.:
mltk train <my model> --clean
Restarting Tensorboard after training has started
Run Tensorboard from remote SSH session
The Tensorboard utility may also be used when training on a remote cloud machine via SSH.
This is done as follows:
1) Configure the Tensorboard callback
Tensorboard must first be enabled so that the necessary logs are generated during model training. This is done by configuring the my_model.tensorboard property in your model specification.
e.g.: Add the following to your model’s Python script:
# https://www.tensorflow.org/api_docs/python/tf/keras/callbacks/TensorBoard
my_model.tensorboard = dict(
    histogram_freq=0,       # frequency (in epochs) at which to compute activation and weight histograms
                            # for the layers of the model. If set to 0, histograms won't be computed.
                            # Validation data (or split) must be specified for histogram visualizations.
    write_graph=False,       # whether to visualize the graph in TensorBoard. The log file can become quite large when write_graph is set to True.
    write_images=False,     # whether to write model weights to visualize as image in TensorBoard.
    update_freq="batch",    # 'batch' or 'epoch' or integer. When using 'batch', writes the losses and metrics
                            # to TensorBoard after each batch. The same applies for 'epoch'.
                            # If using an integer, let's say 1000, the callback will write the metrics and losses
                            # to TensorBoard every 1000 batches. Note that writing too frequently to
                            # TensorBoard can slow down your training.
    profile_batch=(51,51),        # Profile the batch(es) to sample compute characteristics.
                            # profile_batch must be a non-negative integer or a tuple of integers.
                            # A pair of positive integers signify a range of batches to profile.
                            # By default, it will profile the second batch. Set profile_batch=0 to disable profiling.
)
and configure the individual fields as necessary. See the Tensorboard Callback documentation for more details.
2) Train the model on the remote machine
Train the model on the remote machine. This can be done using the mltk ssh train command.
3) Start Tensorboard on the remote machine
From an SSH session, issue the command:
mltk tensorboard <model name>
to start Tensorboard on the remote machine.
4) Open a reverse SSH tunnel on the local machine
One the local machine, issue the command:
ssh -N -L localhost:6002:localhost:6002 <other credentials args>
<other credentials args> are the other SSH arguments necessary to open an SSH session to the remote machine (see mltk ssh train for more details).
This will forward all requests to port 6002 on the local machine to port 6002 on the remote machine. This way, when you open your web-browser to http://localhost:6002, the request will be forwarded to the Tensorboard server running on the remote machine.
5) Open http://localhost:6002 in your web-browser
From your local web-browser, open the page: http://localhost:6002 This should display the remote Tensorboard GUI in your local web-browser.