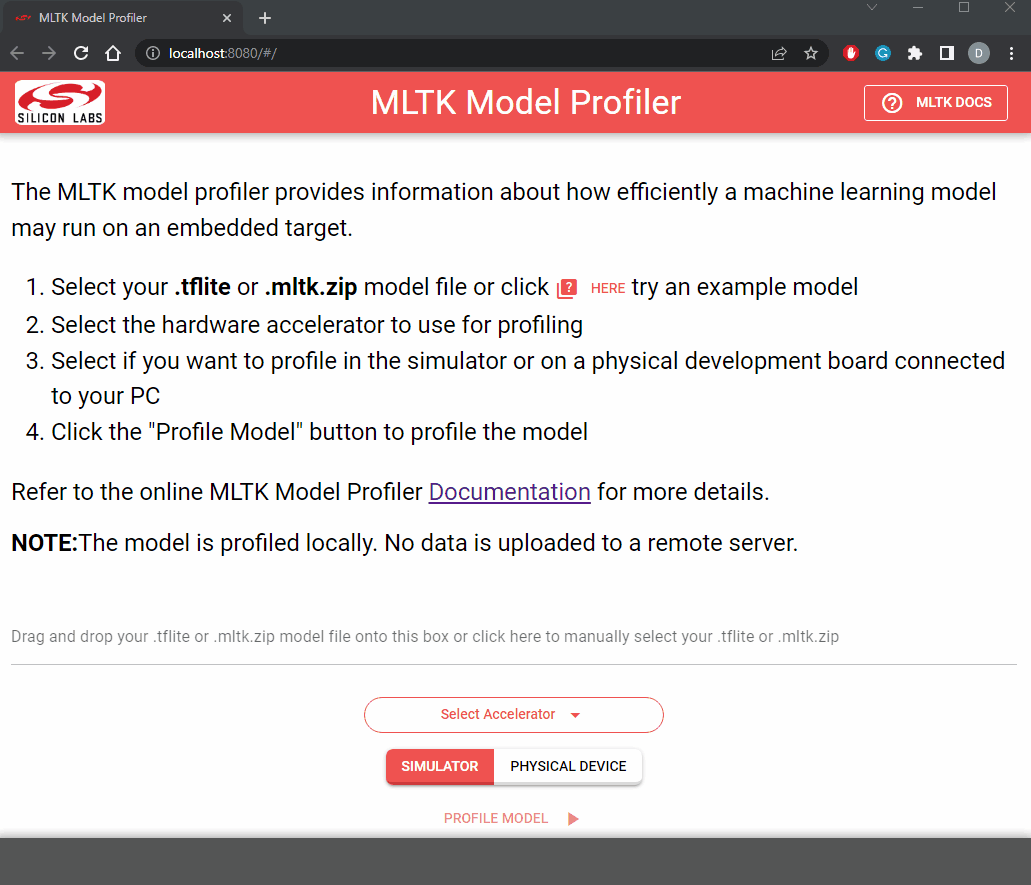
Model Profiler Utility
The model profiler utility effectively wraps the Model Profiler
that comes with the MLTK into a standalone executable with a webpage interface.
It allows for profiling .tflite formatted models in a simulator or on a locally connected
embedded target.
No installation required.
Note
All model profiling is done locally. No data is uploaded to a remote server
Simulated numbers are based on the EFR32xG24
Download
The model profile utility may be downloaded from here:
Usage
To use the model profiler utility:
Download the executable from the link above
After downloading, download-click the executable
The executable will:
1 ) Start a local HTTP server onhttp://localhost:80802 ) Open a webpage in your default browserFrom the webpage, drag and drop your
.tfliteor.mltk.zipmodel file onto the boxSelect the hardware accelerator to use for profiling
Select whether you want to profile using the simulator or locally connected embedded device
Click the Profile Model button
This will profile the given model then display the results.
Refer to the Model Profiler guide for more details on the displayed profiling results.
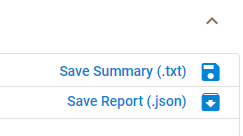
Saving the results
After profiling completes, you can save the results in JSON or text format by clicking the respective button on the top-right:
Local HTTP server options
The profiler webpage is served from a local HTTP server.
By default, the server starts on localhost:8080.
The host and port may be changed by specifying the command line options:
mltk_model_profiler [--host <host>] [--port <port>]
Where:
<host>is the local network host interface IP address, e.g.192.168.1.4<port> is the HTTP server listening port, e.g.8000